Reporting FAQ
How can I see standards in the Reporting system?
Because the Reporting varies based upon the type of assessment administered, viewing standards differs for ClearSight Formative and Interim Assessments.
To view standards for Interim Assessments
1. In Reporting, from the dashboard, navigate to the applicable Interim form name and then navigate to a student-level report for that form. Select the "Standards Keys" toggle, located above the performance table and next to "Test Reasons". This allows you to see the standards for each of the items on the student's test.
2. To download this information, select the "Print" button, next to the "Download Student Results" button, Save to Excel or CSV, then "Confirm". The report that is sent to your inbox will show the standards for the items answered by the student.
To view standards for ClearSight Formative Assessments
1. In Reporting, from the dashboard, navigate to any ClearSight Formative form name. Above the performance table, and next to the "Test Reasons", select the "Standards Keys" toggle. Because each student answers the same set of items on a ClearSight Formative form, the standards for these forms can be seen at all aggregate levels- student, roster, school, and district.
2. There are numerous ways to download standards information for ClearSight Formative forms. The export form icon can be selected next to the ClearSight Formative form name. When the "Export Report for ClearSight Formative:" pop-up displays, select "Overall Test, Reporting Category and Item Performance of all students". If xls or csv is selected for the output type, a table with item sequence and standards is provided. The same information can be accessed by following the steps in the QuickGuide ClearSight Formative Reports - Results In Order By Standard.
What types of information can different levels of users view in the Reporting system?
Once a user has logged into the ClearSight Reporting System and selected a test, the first information s/he will see is the aggregated performance data for the schools within the district and for the district as a whole. These show as summarized scores per school and per the district.
A teacher level user will see roster level data for any rosters assigned to them and student level data for any student rostered to them or any student to whom they have administered a test.
A school level user will see all rosters and student level data within that school.
A district level user will see all schools, rosters, and student level data within that district.
What is the difference between Interim and ClearSight Formative Reports?
ClearSight Formative reports provide information on the number of points earned out of the total points possible on a test as well as the corresponding percent correct on that form. To see examples of ClearSight Formative Reports and how to organize them to view standards information in order, please see the QuickGuide ClearSight Formative Reports - Results In Order By Standard, available on the Resources page.
Interim reports provide a scaled score and the corresponding performance level for both the entire test and each reporting category on the test. For more information on Interim Reports, please see the Interim Assessment Scores document, also available on the Resources page.
What kind of information can I view in a longitudinal report?
A longitudinal report shows a line graph with score data as well as a summary table of the scores. Longitudinal reports become active when there are multiple scores available for a student or group of students for the same test.
For example, if a student has taken an Interim Mathematics Grade 5 Assessment multiple times within a single school year or has taken an Interim Mathematics Grade 4 in one year and Grade 5 in another year, there is the option to build a longitudinal report to view these results together. For Interim tests, longitudinal reports area available at the level of a school, roster/group of students, or student.
In ClearSight Formative Assessments, longitudinal reports are active when multiple opportunities of a single form have been completed or multiple ClearSight Formative forms within the same topic have been completed. The longitudinal reports are presented at the student level.
Why are there 4 performance levels for the overall Interim test scores but 3 performance levels for each reporting category in that Interim?
The overall scale score provided for a student on an Interim Assessment represents how the student performed on the entire Interim Assessment. Three cut scores were established for the Interim Assessments and, as a result, four performance levels—Below Proficient, Approaching Proficient, Proficient, and Highly Proficient.
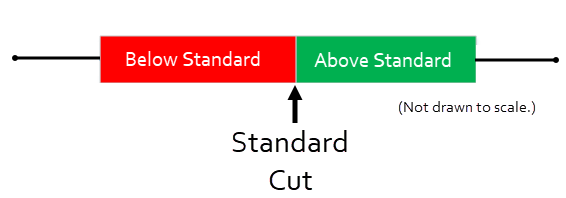
The scale scores at the reporting category level, on an Interim Assessment, are on the same scale but there are fewer items per reporting category than on the entire test. So, some adjustments were made in expressing these reporting category level scale scores. First, it is important to know that the cut between approaching proficient and proficient can be referred to as the standard cut.

It is understood that scores below this standard cut are Below Standard and scores above this cut are Above Standard.

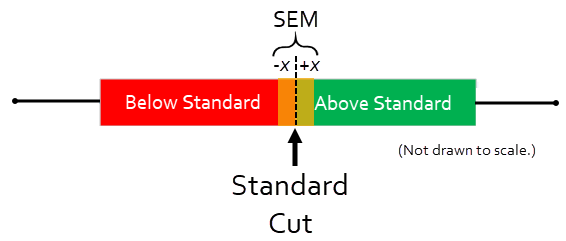
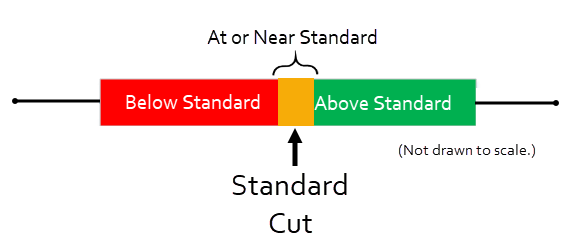
The third performance level, for reporting categories, is determined by the standard error of measurement (SEM) that occurs when calculating a scale score for a single reporting category. The SEM represents a range where a score may be below or above the standard, but due to the SEM, the score cannot be pinpointed exactly. This SEM is placed around the standard cut, plus and minus the same amount on each side of the cut.

If a score is within the range created by the SEM, it is considered At or Near Standard.

To read more about interpreting scores, you can view the document Interim Assessment Scores, which is located on the Resources page.